What epidemiology measures
Melanoma epidemiology examines how common the disease is, how it is distributed across populations and how diagnoses, deaths and survival change over time. It informs prevention, research and health services. These numbers describe groups of people; they do not determine what will happen to an individual after diagnosis.
Four measures must be distinguished. Incidence counts new diagnoses during a period; mortality counts deaths attributed to the disease; prevalence counts people living after a diagnosis; and survival describes the experience of patients followed after diagnosis.
A case count is not a rate. Rates per 100,000 people account for population size, while age-standardised rates reduce the effect of different age structures. Comparisons still require compatible populations, periods and methods. This page concerns melanoma of the skin, rather than combining it with ocular or mucosal melanoma.
Italy: figures and reference years
The melanoma chapter in I numeri del cancro in Italia 2025 reports an estimated 12,941 new diagnoses in 2024: 7,069 in men and 5,872 in women. Its mortality figures refer to a different year: an estimated 2,500 deaths in 2022, comprising 1,500 men and 1,000 women.
The publication year is therefore not the reference year for every statistic. These counts should not be turned into an age-standardised rate simply by dividing by population size, or compared directly with the US rates presented below.
Regional comparisons within Italy require registry data for the same period and standard population. The previous page described a north–south gradient using much older estimates; it is not presented here as a current ranking. Registration completeness also needs to be assessed through quality indicators. A diagnosis made outside a hospital is not automatically absent from a cancer registry.
The updated chart: incidence and mortality over time
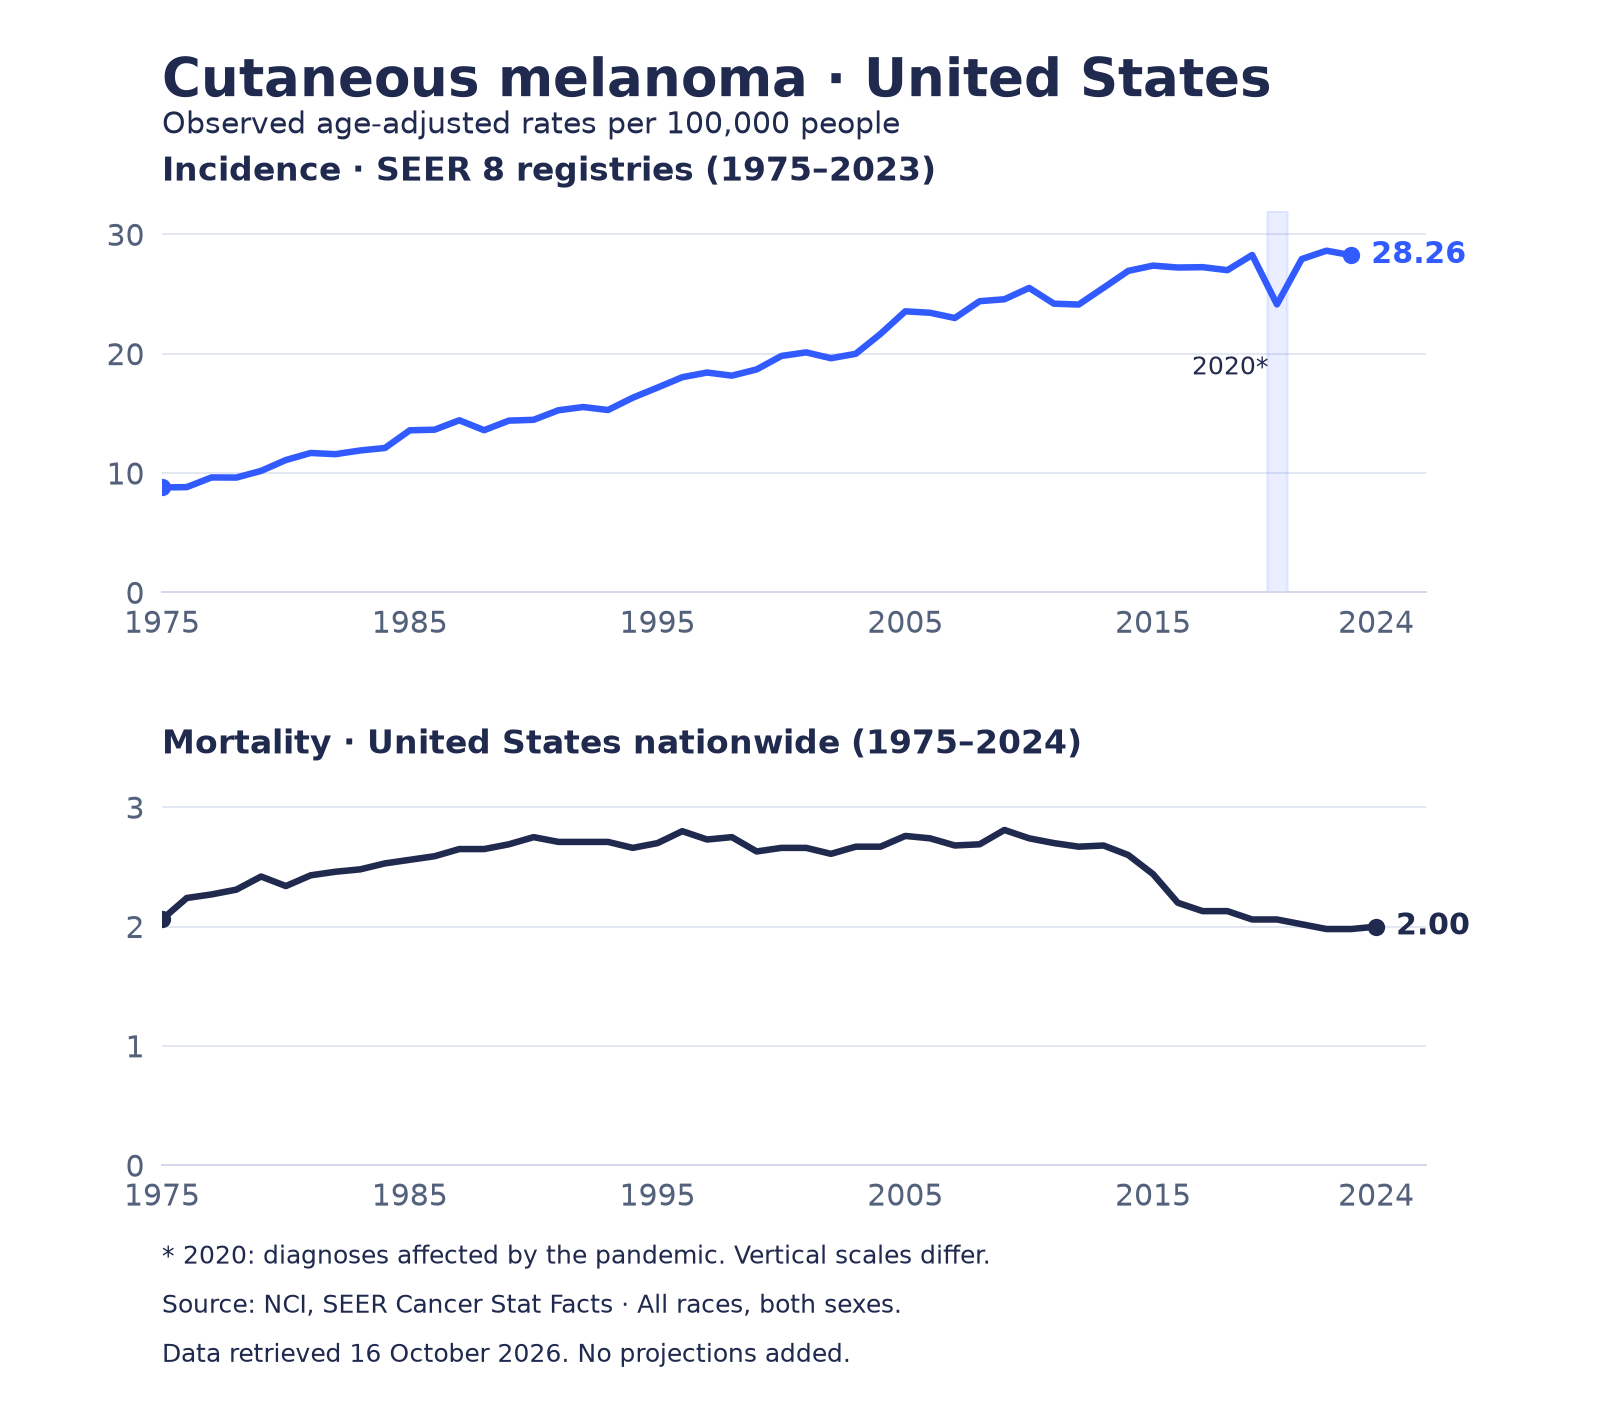
The previous chart showed New South Wales, Australia, from 1987 to 2006. The replacement uses a separate US series: incidence in SEER 8 registries from 1975 to 2023 and nationwide US mortality from 1975 to 2024. Data from another country have not been appended to the old curve.
The chart shows observed age-adjusted rates per 100,000 people, for both sexes and all population groups in the source. The panels use different vertical scales so that mortality remains readable. SEER 8 incidence rises from 8.80 in 1975 to 28.26 in 2023; nationwide mortality is 2.00 in 2024. The dip in recorded diagnoses in 2020 needs to be interpreted in the context of the pandemic.
More diagnoses do not necessarily mean deaths follow the same pattern. The historical SEER 8 series and the SEER 21 table below also cover different sets of registries, so their values are not interchangeable.
View the 50 years of chart data
| Year | SEER 8 incidence | US mortality |
|---|---|---|
| 1975 | 8.80 | 2.06 |
| 1976 | 8.83 | 2.24 |
| 1977 | 9.64 | 2.27 |
| 1978 | 9.63 | 2.31 |
| 1979 | 10.19 | 2.42 |
| 1980 | 11.10 | 2.34 |
| 1981 | 11.69 | 2.43 |
| 1982 | 11.59 | 2.46 |
| 1983 | 11.90 | 2.48 |
| 1984 | 12.11 | 2.53 |
| 1985 | 13.59 | 2.56 |
| 1986 | 13.64 | 2.59 |
| 1987 | 14.43 | 2.65 |
| 1988 | 13.60 | 2.65 |
| 1989 | 14.40 | 2.69 |
| 1990 | 14.47 | 2.75 |
| 1991 | 15.27 | 2.71 |
| 1992 | 15.54 | 2.71 |
| 1993 | 15.29 | 2.71 |
| 1994 | 16.32 | 2.66 |
| 1995 | 17.17 | 2.70 |
| 1996 | 18.04 | 2.80 |
| 1997 | 18.43 | 2.73 |
| 1998 | 18.17 | 2.75 |
| 1999 | 18.69 | 2.63 |
| 2000 | 19.82 | 2.66 |
| 2001 | 20.12 | 2.66 |
| 2002 | 19.63 | 2.61 |
| 2003 | 20.00 | 2.67 |
| 2004 | 21.67 | 2.67 |
| 2005 | 23.56 | 2.76 |
| 2006 | 23.44 | 2.74 |
| 2007 | 23.00 | 2.68 |
| 2008 | 24.41 | 2.69 |
| 2009 | 24.57 | 2.81 |
| 2010 | 25.52 | 2.74 |
| 2011 | 24.20 | 2.70 |
| 2012 | 24.13 | 2.67 |
| 2013 | 25.53 | 2.68 |
| 2014 | 26.95 | 2.60 |
| 2015 | 27.39 | 2.44 |
| 2016 | 27.23 | 2.20 |
| 2017 | 27.26 | 2.13 |
| 2018 | 27.01 | 2.13 |
| 2019 | 28.28 | 2.06 |
| 2020 | 24.14 | 2.06 |
| 2021 | 27.94 | 2.02 |
| 2022 | 28.64 | 1.98 |
| 2023 | 28.26 | 1.98 |
| 2024 | — | 2.00 |
Incidence by sex and population group: 2019–2023
The table replaces the 2001–2005 figures with SEER 21 data for 2019–2023. Values are annual new cases per 100,000 people, age-adjusted. The labels follow US demographic reporting: Hispanic denotes ethnic origin, while the other specified groups are non-Hispanic.
This distinction also prevents misleading comparisons with the labels used in the old table. Demographic groups are not biologically uniform categories and do not, by themselves, explain the observed differences. Assessing change within a group requires a series with consistent definitions and coverage, not simply subtracting figures from two tables published in different editions.
| Source population group | Males | Females |
|---|---|---|
| All Races | 28.3 | 17.9 |
| Hispanic | 5.0 | 5.0 |
| Non-Hispanic American Indian/Alaska Native | 11.3 | 7.7 |
| Non-Hispanic Asian/Pacific Islander | 1.3 | 1.2 |
| Non-Hispanic Black | 1.1 | 0.9 |
| Non-Hispanic White | 40.7 | 27.6 |
Source: NCI SEER Cancer Stat Facts. “All Races” is the overall figure, not an additional group to add.
Age, sex and lesion location
Melanoma is not only a disease of younger adults. In US SEER 21 data for 2019–2023, the median age at diagnosis is 67, and the 65–74 age group accounts for the largest share of new cases. This US median should not be presented as the average age in Italy. Melanoma can nevertheless occur earlier in life and remains rare in children.
The same source shows a higher overall incidence rate in males than females: 28.3 versus 17.9 per 100,000. The old page’s general statement of female predominance therefore does not describe every population or age group.
The trunk is a common site in men, while the limbs are often affected in women. These are statistical patterns, not rules for dismissing a lesion. Changes on the skin, scalp, palms, soles or nails still deserve attention regardless of sex.
Geography and skin colour
Melanoma frequency varies substantially around the world. Australia remains an important setting for studying UV exposure and prevention. Cancer Australia reports 15,034 new diagnoses in 2021 and an age-standardised rate of approximately 60 per 100,000 people. These are Australian national figures, separate from the old regional New South Wales chart.
International comparisons must consider the standard population, registry quality, age composition and how cases are recorded. Two rates both described as “age-standardised” may use different reference populations and may not be directly comparable.
Overall incidence is lower in people with darker skin, but melanoma can still occur. A greater proportion of acral lesions among a population’s melanomas does not necessarily mean a higher absolute risk of that subtype. The US table does not demonstrate that foot injuries cause melanoma. The earlier explanation involving barefoot walking is not presented as an established cause.
Sun exposure, habits and prevention
Ultraviolet radiation is an important modifiable risk factor for many cutaneous melanomas. Intense intermittent exposure, sunburn and tanning lamps remain central prevention concerns. However, an incidence chart alone cannot measure how much each behaviour contributed to a trend. Ageing, greater diagnostic attention and changes in registration can also play a part.
The personal observations in the previous page have been reframed as general guidance, without attributing an individual diagnosis to that person’s habits. Seeking shade, avoiding artificial tanning, wearing protective clothing and applying sunscreen correctly are complementary measures.
Preventing sunburn is particularly important for children. Sunscreen is not a reason to prolong exposure. After swimming, sweating or towel drying, it should be reapplied according to the product instructions. There is no universal rule that protection disappears after ten minutes: formulation, quantity, water and behaviour all matter.
Mortality and survival: what has changed
US age-adjusted mortality has fallen compared with levels seen in the early 2010s. Timely diagnosis remains important, but attributing the improvement solely to dermoscopy would be incomplete. Analyses discussed by the National Cancer Institute also point to a substantial contribution from treatment advances, particularly immunotherapy and targeted therapies for advanced disease.
SEER reports 94.7% five-year relative survival for 2016–2022, all stages combined, in SEER 21 registries excluding Illinois. Relative survival compares patients’ survival with that expected in the general population. It is not an individual person’s probability of being cured.
Stage, tumour characteristics, general health and treatment affect the clinical picture. Mortality and survival also have different denominators: mortality concerns the population, while survival concerns people diagnosed with the disease. They should not be treated as equivalent ways of measuring the same outcome.
How to interpret updates without mixing datasets
Registries need time to collect, check and consolidate diagnoses. A source accessed in 2026 may therefore contain observed incidence from 2023, mortality from 2024 and projections for later years. The chart on this page uses observed values; the Italian case counts are explicitly identified as estimates.
Lifetime risk is a different measure again. SEER estimates it at approximately 2.2%, based on 2021–2023 data. It is not an annual risk and should not be compared directly with the old “1 in 75” figure without knowing the population and calculation method.
Each update should retain the source, period, cancer definition, registry coverage and standardisation method. Statistics help explain patterns and plan prevention. If a concern involves a particular lesion or personal pathology report, medical assessment remains the appropriate point of reference.
Sources and update
- NCI SEER — Melanoma of the Skin, Cancer Stat Facts
- AIOM — I numeri del cancro in Italia 2025, p. 154
- Cancer Australia — Melanoma of the skin statistics
- NCI — US Deaths from Melanoma Drop Substantially
- NCI SEER — Defining Cancer Statistics
- AIRC — Melanoma cutaneo
Editorial update and source access: 16 October 2026. Historical data and estimates retain the reference years shown. This information does not replace medical assessment.